


Fixed income analytics comes of age.
 By Ruben Costa-Santos, Head of Multi-Asset Analytics, and Milan Borkovec, Head of Analytics Quantitative Research at Virtu Financial.
Under MiFID II, the obligation to execute orders on terms most favourable to the client is unequivocal and asset-class neutral. Over the course of the last three years, MiFID II’s best execution guidance has become a global call to action. In lockstep, Transaction Cost Analysis (TCA) has evolved from being primarily equity-focused into a multi-asset class practice.
This evolution has been particularly striking in Fixed Income, once perceived as an asset class resistant to quantitative performance metrics. Fixed Income TCA is now a meaningful tool used extensively by buy side firms. Less well known may be that Fixed Income analytics includes advanced liquidity-related metrics, such as pre-trade cost and market impact models, previously used predominantly in equities trading. In this article we explore the expanding field of Fixed Income analytics.
Pre-trade cost models in fixed income
Pre-trade models need to account both for spread cost (the cost of instantaneous liquidity demand) and market impact (the liquidity cost of an asset traded over the entire execution period). Expected costs are typically modelled against multiple factors that characterise the underlying instrument and are calibrated against venue market data, regulatory reporting data, and large datasets of anonymised buy side execution data.
Model-based cost estimates can be particularly relevant in Fixed Income due to its large number of tradable instruments, with varying level of liquidity, and often limited market data availability. A pre-trade model that accounts for the relevant instrument characteristics calibrated against historically available market data, and produces reliable estimates of expected cost and liquidity, is a game changer that can be used by portfolio managers and traders in a variety of applications.
Use case #1: pre-trade cost model use in portfolio construction
Portfolio liquidity monitoring is not only a regulatory requirement (MiFID II guideline for bond liquidity and Rule 2e-4 in the US). It also provides practical means to manage the impact of implementation costs on portfolio construction. One possible use is capacity analysis, which is the process of determining the point at which the fund size becomes too large, so that transactions costs start to impair the alpha being generated.
Liquidity scoring can also be used to facilitate the selection of easier-to-trade bonds among securities with comparable characteristics, as bonds that are nearly identical for portfolio construction purposes can have quite different liquidity profiles. Using a configurable framework to define comparable bonds, portfolio managers and traders are then able to scan for bonds while accounting for liquidity.

Figure 1, depicts an example of portfolio liquidity analysis, using a five-tier liquidity score, for iShares Core US Aggregate Bond ETF (Ticker: AGG). Users may also calculate the expected cost to liquidate over various time horizons.
Use case #2 pre-trade execution strategy selection
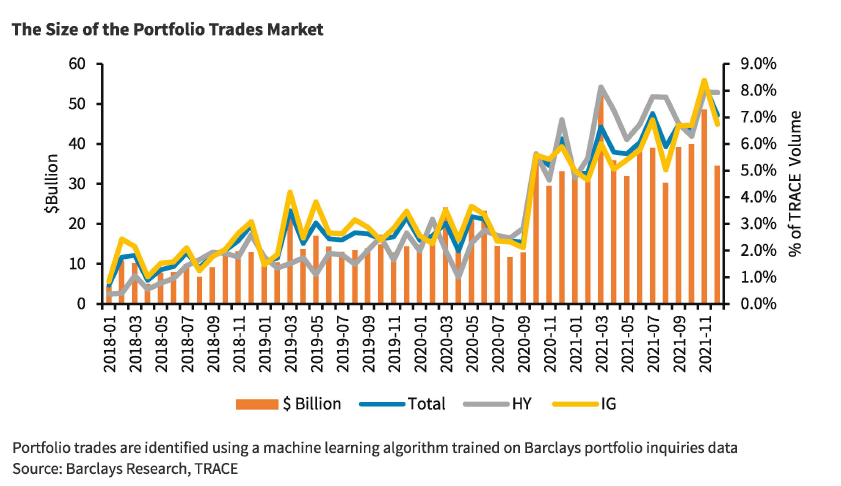
Fixed Income trading is evolving from mostly liquidity-seeking and full risk transfer approaches into increased use of electronic trading and alternative execution methods such as portfolio trading. This makes the concept of execution strategy selection – as used in equities and FX trading – relevant for fixed income instruments as well.
Pre-trade cost estimates provide a streamlined way to categorise orders by level of difficulty, which can guide the trader’s execution decision, for instance to trade via RFQ or take a negotiated approach with a selected dealer.
Similarly, pre-trade cost estimates can be incorporated in auto-routing decision-making process that determines which orders can be sent to automated electronic trading systems and which orders may require high-touch or manual handling. Pre-trade cost estimates combined with post-trade TCA are well suited for this type of semi-automated workflow.
Use case #3 post-trade TCA
One important characteristic of post-trade TCA is that averaging performance over many trades removes idiosyncratic market noise and allows for the analysis of cost trends. There is, however, the additional challenge of adjusting for trade difficulty due to trade size, instrument liquidity, or market conditions.
Consider for instance, a side-by-side comparison of performance between two brokers, traders or execution strategies. Unless orders were randomly assigned, the possibility exists that one execution channel handled harder-to-trade orders than the other channel. Aside from algo wheels, random order assignments are rare, and model-based expected cost can help to account for trade difficulty in post-trade TCA. This can be implemented either by directly adjusting costs based on trade difficulty or, alternatively, by using liquidity scores to bucket orders by the degree of difficulty. Either approach helps to improve the quality of post-trade TCA by providing more reliable comparative metrics.
Use case #4 aggregate liquidity metrics to monitor market conditions
FI liquidity scores can also be aggregated across market segments, or bond categories, to monitor market liquidity over time and help provide an early warning on market dislocations.

Figure 2 illustrates the use of aggregate FI liquidity scores. In this example, the liquidity of TIPS (Treasury Inflation-Protected Securities) and broader Treasuries securities is compared during March 2020, using Virtu’s FI liquidity scores. In early March, most Treasuries and TIPS were ranked as very liquid. However, around 9 March 2020, Virtu’s liquidity scores for the two groups of bonds diverged sharply. While most Treasuries experienced relatively minor deviations from their pre-Covid liquidity levels, TIPS experienced a massive migration to lower liquidity buckets which reflected the market sell-off due to sharply reduced inflation expectations.

Figures 3a and 3b show how this liquidity event was reflected in Virtu’s pre-trade cost estimates and in market-quote spread. The advantage of using aggregated liquidity score is that it combines both modelled quantities and market observed metrics.
Also noteworthy, is how quickly liquidity scores reflected the dislocation in TIPS supply and demand, showing very little lag relative to the precipitating dip in inflation expectations.
Conclusion
Supported by advanced metrics such as pre-trade cost models and liquidity scores, Fixed Income Analytics has come of age and continues to evolve. We believe that model-based metrics are particularly relevant for Fixed Income as they enable traders and portfolio managers to extract actionable insight from extensive but often fragmented and incomplete market data, providing a solid basis for quantitative approaches to portfolio construction and trading.
©Markets Media Europe 2021
TOP OF PAGE


